Ever run a Lighthouse test and wonder why the results don’t match what real users experience? Yes, you are not alone, and it is something that frustrates developers, SEOs, and product teams everywhere.
Lighthouse offers lab data, or I say, synthetic findings from a test environment. But Field data, in contrast, is from actual users who check out your site on varying devices, networks, and geos. Of course, these two data points can be different.
So, why does Lighthouse Lab Data not match Field Data? Is one preferable to the other? And how do you apply both types of data to make wise website decisions?
Here at this blog, we will dissect the reasons for the mismatch, discuss the limitations and strengths of lab data as well as field data, and provide you with actionable advice on how to leverage them together to derive improved performance insights. So let’s start with:
Table of Contents
Understanding Lighthouse Lab Data
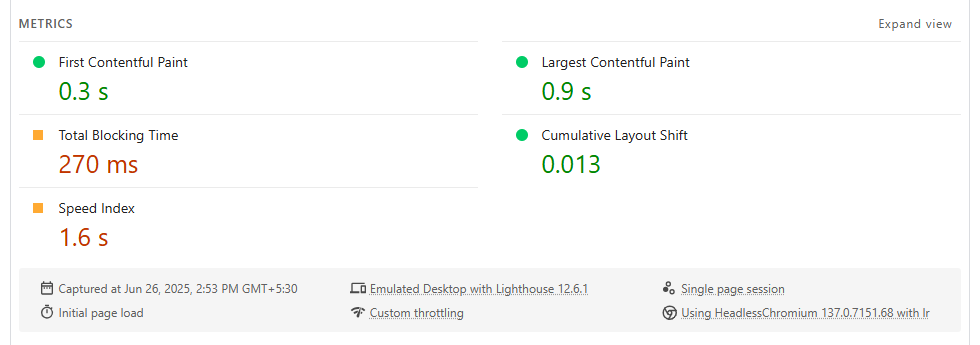
This platform was developed by Google and is an effective instrument for testing and optimizing site performance. When you execute a Lighthouse audit through Chrome DevTools or PageSpeed Insights, you obtain lab data, not actual data.
In other words, it originates from a regulated environment with predetermined parameters, like:
- A mid-range smartphone.
- A sluggish 4G connection.
- The most recent version of Chrome.
- No browser cache.
As you can see, this setup simulates a typical user with limited resources. So, even if you test from New York or New Delhi, the results are predictable and not influenced by any factor.
However, it has significant advantages in:
1. Consistency
Lighthouse applies the same settings repeatedly, so you can confidently compare results post-updates. And yes, you would be on the same scale every day.
2. Repeatability
Because there is no real-world noise, the outcomes you get will remain stable across tests. This further simplifies the measurement of performance gains for you, such as quicker image loads or reduced JavaScript.
3. Debugging
Lab data provides in-depth insights, so you can investigate what’s holding your site back. You can see that Factors like render-blocking scripts or large LCP elements are reasons, through detailed reports and waterfall charts.
Although it may not display all the experiences of all users, Lighthouse lab data will assist you in testing, debugging, and optimizing your site before it hits actual users. Now move forward with understanding the real user monitoring data because that takes you closer to figuring out why Lighthouse Lab Data does not match Field Data.
What Is Field Data? (Real-World Data)
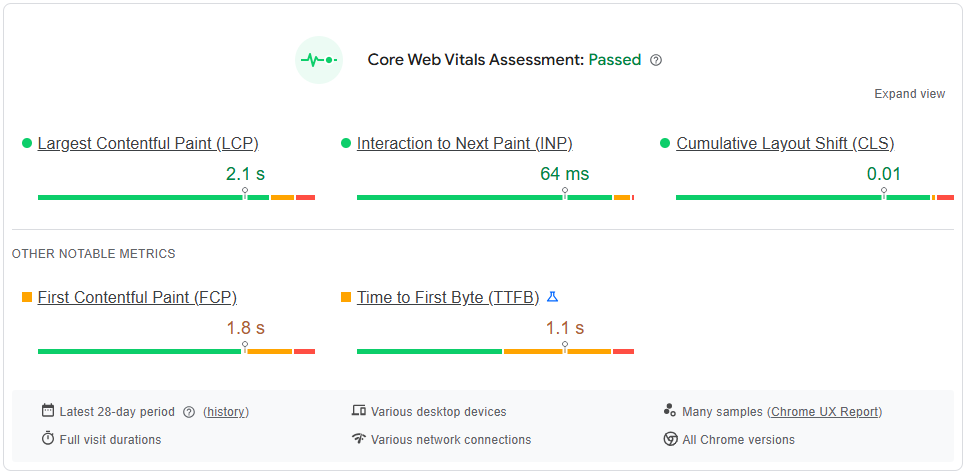
It shows how your website performs for actual visitors in the real world. It’s collected from real people using real devices on real networks.
This information is frequently obtained from the Chrome User Experience Report (CrUX), which collects randomised performance statistics from users who have opted in to share their data.
Unlike lab data, field data doesn’t come from a controlled environment. It captures how your site behaves across a wide variety of scenarios. This includes:
- Different devices, from high-end iPhones to old Android phones.
- Network conditions range from fast Wi-Fi to slow 3G mobile connections.
- Geographic locations, rural vs. urban, country vs. country
- Browser types and versions.
- User behavior, for example, a user scrolling quickly vs. one who waits for a video to load.
Because field data reflects actual user experiences and which makes it incredibly valuable. It shows what really happens when people visit your website, not what might happen in ideal conditions.
- How fast your main content loads, or I directly say the LCP metric.
- First Input Delay (FID), which is how responsive your site feels.
- Cumulative Layout Shift (CLS) states how stable your page layout is.
Key Reasons Why Lighthouse Lab Data Does Not Match Field Data
A gap between your Lighthouse lab scores and the field data is actually normal. Both datasets are valuable, but they measure performance under very different conditions.
Let’s break down the major reasons (other than different testing environments, network, or device) why these two types of data don’t always match up.
1. Caching & Performance Enhancements
Lighthouse tests your website as though it were being loaded for the first time. And during that, it does not consider browser cache, stored fonts, or saved JavaScript files. It is a completely fresh session.
But real users often visit your site more than once, and their browsers store static assets. Which means they don’t need to download everything again. They might use a Content Delivery Network (CDN) to load your site to load pages even faster.
So if your Lighthouse score shows slower speeds, but your field data looks better, caching is likely helping real users get a faster experience than what lab tests can reflect.
On the flip side, if your cache settings are not configured well, or users are loading fresh content each time, your field data might reveal slower performance that Lighthouse won’t catch.
2. The Update Delay in Real-World Data
Another key difference why Lighthouse Lab Data does not match Field Data lies in how recent the data is.
Lighthouse gives you instant feedback. You can run a test today, and you will see results based on the current state of your website.
Field data, however, is based on the past 28 days of aggregated user data. So even if you just fixed major issues, it will take time before those improvements reflect in the field data. This lag often causes confusion.
3. User Behavior Differences
Lab tests are straightforward because the tool loads your page, waits for the above-the-fold content to appear, and stops. It does not scroll, click, or hover on any element.
But real users? We can’t be sure what they will interact with. Some might scroll rapidly and trigger lazy-loaded images. Others may click on pop-ups or videos. A few might bounce within seconds.
Performance metrics like LCP and TBT are impacted by these interactions, particularly on pages with a lot of content or interactive elements.
On top of that, it is impossible to reproduce that kind of behaviour in a laboratory test. That is why field data, filled with diverse actions, often shows slower (or sometimes faster) results than the lab numbers. This is the straight reason why Lighthouse Lab Data does not match Field Data.
4. Third-Party Scripts & A/B Testing
Some performance killers, such as analytics tools, live chat widgets, ads, and personalization engines, don’t always load the same way for every user.
Some might only appear based on user location or behavior, and others (like A/B testing platforms) can alter the page structure dynamically.
In lab testing, these scripts often don’t run or behave differently because the test doesn’t trigger all the conditions that make them appear.
But in the real world, users might experience layout shifts, slowdowns, or delayed interactions caused by these external scripts.
This results in real-user metrics taking a hit, especially for Core Web Vitals like CLS (if a popup shifts content) or FID (if a script delays input response).
And since search rankings are based on field data, third-party scripts can quietly damage your SEO and UX without showing up clearly in Lighthouse.
However, let’s be clear, Lighthouse lab data and field data are not enemies. They are just two sides of the same coin, and both are essential for a solid performance strategy. And in the next section, we will talk about how to use both of these for optimum performance results.
How to Use Lighthouse and Field Data Together?
You know what you can get the best of both worlds: precision in testing and truth from the field. But how? Here is how you can smartly combine both datasets for maximum impact:
1. Start with Lab Testing
First things first, always do a Lighthouse audit in Chrome DevTools or PageSpeed Insights. This step in Web page performance analysis can be considered as the first step, and Lighthouse as the first tool to catch big issues like large images, unused scripts, or slow elements in a clean, controlled setup.
2. Fix Issues Before Going Live
Now improve loading times, defer JavaScript, and compress images in response to the audit. But most of all, test again on Lighthouse to make sure your score has improved before going live.
3. Deploy Changes & Wait
Here comes the part to update your live site with the changes. However, you must be patient because gathering field data takes time. And scores also won’t be updated right away, as they are based on the last 28 days of real-user data.
4. Track Field Data
Now is the time to monitor your website’s performance using tools like the CrUX Dashboard, PageSpeed Insights’ Field Data tab, and Core Web Vitals report of Google Search Console. This way, you will be able to more attentive towards LCP, FID, and CLS metrics across different devices and locations.
5. Examine Both Outcomes
You will now be comparing your Lighthouse results with real-world field data if they match. Usually they don’t come as same as discussed above.
6. Get Better Using Actual User Data
If your field data still doesn’t look good, here comes the need to dig deeper. And for this, you have to check if there are issues on mobile devices, in certain locations, or with slow input delays. Then, return to Lighthouse and test under similar conditions to fix them.
7. Continue Testing and Monitoring
What-so-ever, we understand that you realize performance is not a one-time fix. You need to test often and keep running Lighthouse audits, and monitor your field data every month. Because that is the only way to keep your website fast, smooth, and SEO-strong.
However, this is always forgotten because you have to handle so much in one go, but not anymore. Now you have access to the W3Spedx free plan that allows you to add and monitor your 5 sites with up to 5 URLs for absolutely free. Wanna know more about w3speedx, then continue reading.
Power Your Performance with On-Time Smarter Insights
Now you perfectly know why your Lighthouse Lab Data does not match Field Data. However, tracking or testing both, and troubleshooting at the right time across multiple URLs can be time-consuming
But with W3Speedx 24/7 Core Web Vitals monitoring, daily automated reports from PageSpeed Insights, and customizable dashboards with historical trend graphs, you get clarity and control over your optimization workflow. You can have access to instant alerts whenever metrics dip below your defined thresholds, and all for multiple sites in one place.
So what are you waiting for? Sign up now because this is your chance to build a website that is fast, stable, and optimized for both users and search engines.
Read More
Introducing W3SpeedX: The Ultimate Tool for Website Speed Monitoring
Read More
Ultimate 5 Reasons Why Website Monitoring Is Important